Water4Change: An interactive roadmap for urban water management in India
For the Dutch research institute DRIFT, we developed the website for Water4Change (W4C), an interdisciplinary research program focused on sustainable and resilient water management solutions in Indian cities. W4C brings together scientists, policymakers, and local communities to develop innovative, context-specific water strategies. One of the core aspects of the project was visualizing complex networks and processes in an accessible way. To achieve this, we developed the Pathways component, an interactive tool that allows users to easily explore and understand the relationships between water management processes.
A smart algorithm for complex networks
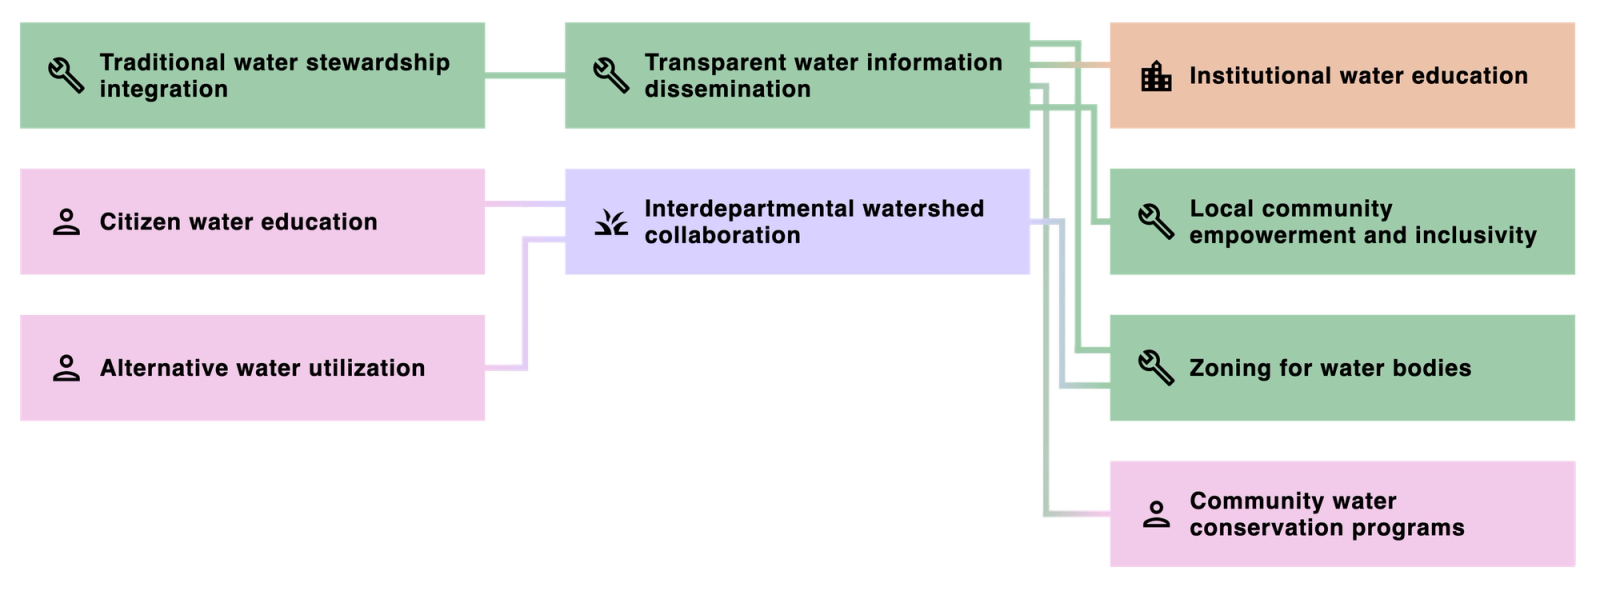
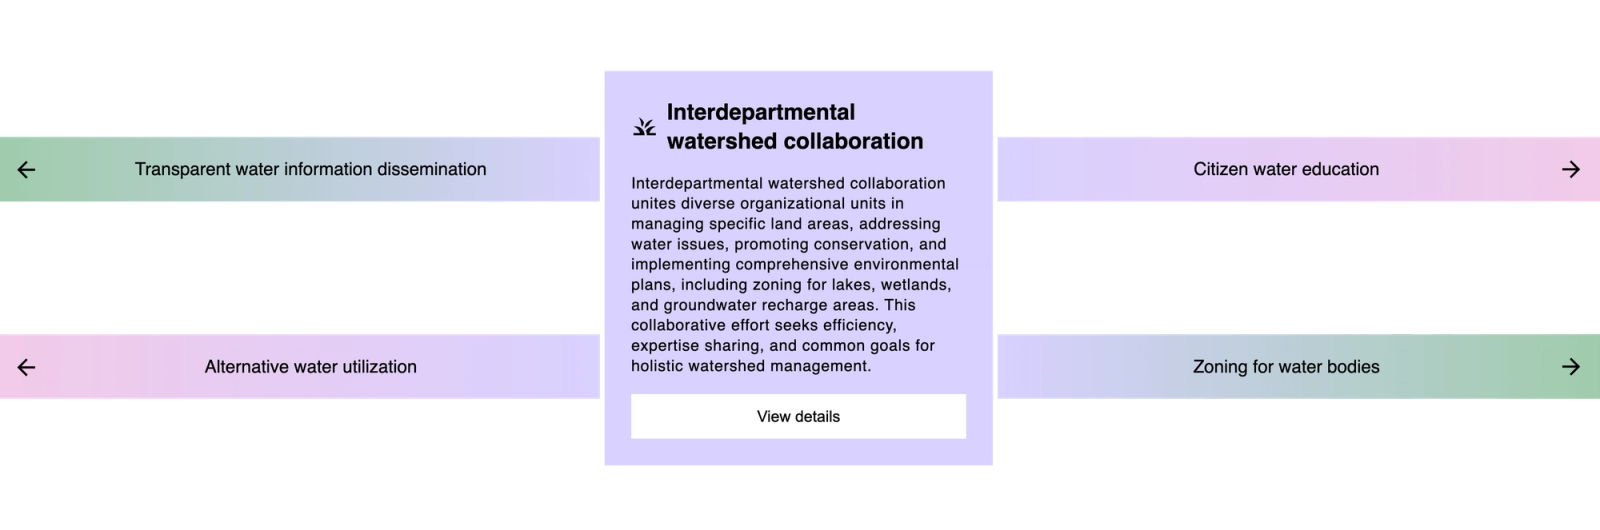
The Pathways component consists of cards connected by lines, where each process is a link in a larger system, and the lines represent relationships between these links. This component needed to meet several key requirements:
• Dynamic data integration – The system had to process and automatically visualize data from a CMS.
• Automatic layout positioning – Processes had to be placed so that lines would not overlap, ensuring clarity.
• Scalability – The system needed to function regardless of the amount of data and expand flexibly as the roadmap grew.
How we built the pathways component
At the core of this component is an algorithm that automatically determines the best positioning and layout. This algorithm analyzes:
• Optimal spacing between processes
• Where to draw lines without overlap
• How to keep the visualization intuitive, no matter how much data is displayed
Example calculation: vertical distances
To calculate the vertical positions of the processes, we developed a function that determines how far apart they should be placed:
export const getVerticalDistances = (refs: RefItem[],): { id: string; distances: Record<string, number> }[] => {const verticalDistanceArray = refs.map(ref => {const distances: Record<string, number> = {};ref.relationIds.forEach(relationId => {const relatedRef = refs.find(item => item.id === relationId);if (relatedRef) {const distance = relatedRef.rect.bottom - ref.rect.bottom;distances[relationId] = distance;}});return { id: ref.id, distances };});return verticalDistanceArray;};
To optimize line positioning, the algorithm uses offsets to prevent connections from crossing. This is achieved using a mathematical model that evenly distributes the available space:
export const getLeftOffsets = (process: LinkedProcess, pathwayCardHeight: number): number[] => {const offsetArray = process.relationIds.map((_, i) =>-pathwayCardHeight / 2 +(pathwayCardHeight / (process.relationIds.length + 1)) * (i + 1));return offsetArray;};
Finally, these calculations are passed as variables to a React component, which generates an SVG-based visualization with the correct layout and connections:
<svg xmlns="http://www.w3.org/2000/svg" height={verticalHeight}><linex1={0}x2={24 - horizontalOffset + strokeWidth / 2}y1={yStart + leftOffset}y2={yStart + leftOffset}/><linex1={24 - horizontalOffset}x2={24 - horizontalOffset}y1={yStart + leftOffset}y2={yStart + difference + rightOffset + strokeWidth / 2}/><linex1={24 - horizontalOffset - strokeWidth / 2}x2={48}y2={yStart + difference + rightOffset}y1={yStart + difference + rightOffset}/></svg>
The result: an intuitive and dynamic component
The Pathways component automatically generates a structured and scalable visual representation of urban water management processes. Each process is interactive—users can click to access more information or explore related processes. The dynamic layout ensures clarity and usability, even when dealing with a large number of processes and relationships.
An interactive and scalable approach
By integrating data-driven design and algorithmic layout optimization, the Pathways component transforms complex relationships into an intuitive and accessible roadmap. For more information about Water4Change and the research behind it, visit the official website: https://w4cproject.org/home/.